Quote of the day from Benjamin Franklin "The way to wealth, if you desire it, is as plain as the way to the market. It depends chiefly on 2 words. Industry and Frugality. That is, waste neither time or money, but make the best of both"
Take a look at the Nasdaq, Dow and S&P index for today..... they are all going down.
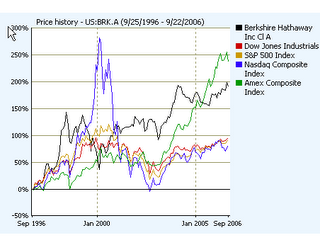
However, have a look at Bershire Hathaway A stock compare with the Major indexes like Dow Jones, Nasdaq, S&P500 and Amex:
For the last ten year, Berkshire Hathaway has perform much better than all the indexes except for Amex which is currently ahead of BRK.A.
Also noticed the chart in blue.. the Nasdaq index that has spike during the technology boom period from the 1999 to 2000.
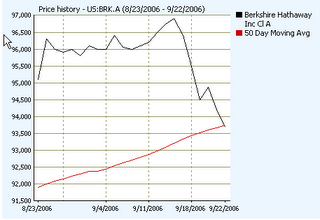
Now let look at a month performance of BRK.A compare to its 50 days moving average:
At this moment, the BRK.A intersect with its 50 days moving average. Normally, from a technical analysis point of view, when a stock price is above the 50-day simple moving average, then there might be a tendency toward continued growth. Since in this case, they meet at a cross junction with the 50-day average tending up and the stock tending down, then it might goes down further. Let see.... :)
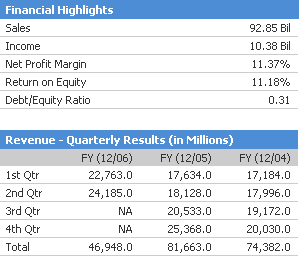
If you look at the Net Profit margin, it is just a moderate 11.37% for an investment firm like Birshire Hathaway, so the remaining 88.63% go to COGS (which is not much for investing firm), operating expenses(OE) and non-recurring charges(NRC). You may want to take a further look why so much of sales money is spent on OE and NRC.
The Dept to Equity Ratio is moderately low, thus we can somehow conclude that it is not heavily financed. Thus Return on Equity(ROE) is good enough to measure the company performance based on the Net Worth that it is holding, no need to use ROIC. ROE of 11.18 is moderately good. However, i expect higher ROE from Bershire.
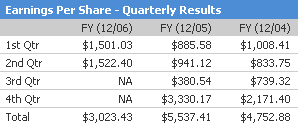
If you compare the sales revenue and EPS for the last three years, you will notice that it is pretty consistent relatively. Meaning if you take the ratio of Sales with EPS, there are almost the same for the last three year. This indicate that there are no manufactured earning through buying back of shares, large increase/decrease of non-recurring charges etc. etc., which is good.
However, please bear in mind that the EPS and sales for year 2006 has not factor in the Q3 and Q4 earning and sales. Barring unforseen circumstances, it should outperform last year EPS and Sales should outperform 2006 result.
Saturday, September 23, 2006
Bershire Hathaway A stock - a simple analysis
Posted by
Yew Heng Chiong
at
9/23/2006 02:56:00 AM
![]()
Subscribe to:
Post Comments (Atom)


No comments:
Post a Comment